
In the Age of Microservices, Monitoring Made Easy with Prometheus
In today’s world dominated by microservices, maintaining and monitoring each service can be a daunting task. Imagine visiting your webpage, only to find it unresponsive. You scramble to diagnose the issue, checking the front-end services first. You discover the backend isn’t responding correctly, leading you to investigate backend service errors. Finally, you might uncover the root cause: the database is failing to respond to queries. This troubleshooting can be incredibly time-consuming. Thankfully, Prometheus is here to help.
💭 What is Prometheus?
Prometheus is an open-source monitoring system designed to collect metrics from various sources, store them in a time series database, and expose them through a RESTful API. It’s a popular choice for monitoring microservices and containerized applications.
Prometheus empowers you to:
- Expose important metrics from your resources.
- Collect and store data in a time series database.
- Trigger alerts or notifications based on predefined conditions.
Developed using Go and maintained by the Cloud Native Computing Foundation, Prometheus has become a cornerstone of modern monitoring practices.
Unveiling the Prometheus Architecture
Prometheus Server:
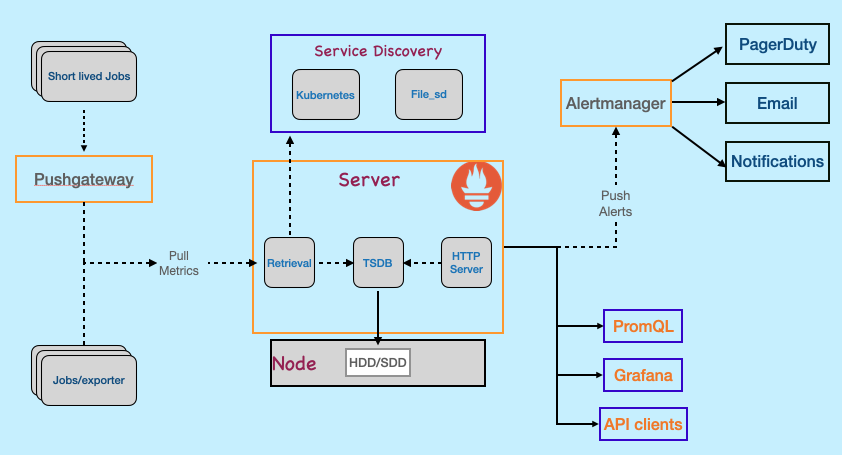 The heart of the architecture, the Prometheus server, collects metrics and stores them in a time-series database. It can handle short-lived jobs through a push gateway, allowing them to push metrics directly instead of waiting to be scrapped.
-
Targets: These are the services or machines you want to monitor, such as virtual machines in AWS or containerized services running on EC2 instances.
-
Client Libraries: For easy monitoring integration, Prometheus offers client libraries that can be added to your application code.
-
Exporters: When client libraries aren’t feasible, exporters (like those for HAProxy or Linux systems) are used to expose Prometheus endpoints.
-
Configuration File: This file defines the targets to be monitored. For dynamic targets, service discovery can be employed.
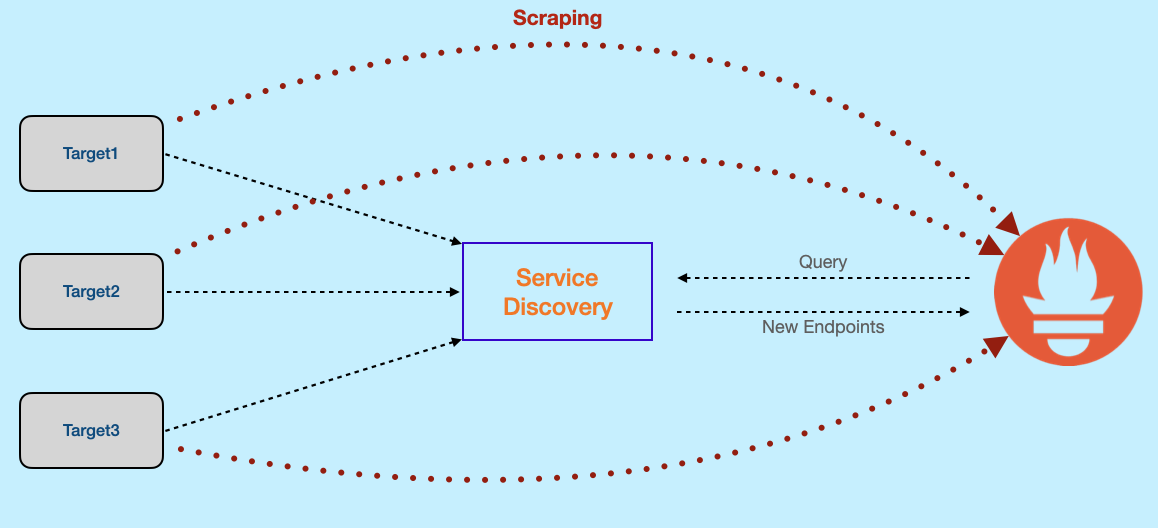
Service Discovery
Service discovery in Prometheus is the process of automatically finding and registering the endpoints of targets for scraping. This is crucial because targets can be dynamically created or destroyed and might reside across various locations. For instance, in a Kubernetes cluster, pods from the same service can be spread across multiple nodes, and pods or nodes themselves can be dynamically created or destroyed.
Several service discovery mechanisms can be used with Prometheus, including:
- Kubernetes Service Discovery: Built-in to Kubernetes, this mechanism helps discover endpoints of Kubernetes services.
- Consul Service Discovery: CA popular service discovery system for finding endpoints of any service.
- Etcd Service Discovery: A distributed key-value store that can be used to store service endpoint information.
- File-based Service Discovery: A manual approach where you specify target endpoints in a file.
The specific steps involved in service discovery vary depending on the chosen mechanism. However, the general flow involves:
- Target registration with the service discovery system.
- Information storage about the target by the service discovery system.
- Prometheus querying the service discovery system to locate target endpoints.
- Prometheus scraping metrics from the targets.
Time Series Database
After collection, metrics are stored in a time series database (TSDB). This specialized database efficiently stores and queries data as a series of measurements over time. Designed for scalability, it allows you to store vast amounts of data without compromising performance.
PromQL
PromQL, short for Prometheus Query Language, is your key to unlocking the treasures hidden within your Prometheus monitoring data. It empowers you to craft powerful queries, navigate through mountains of metrics, and extract insights that illuminate the health and performance of your systems. PromQL expressions can be displayed as graphs, viewed as tabular data in Prometheus’s expression browser, or consumed by external systems via the HTTP API https://prometheus.io/docs/prometheus/latest/querying/basics/.
Here are some PromQL examples:
# Return all time series with the metric http_requests_total:
http_requests_total

# Return with the given label
http_requests_total{job="apiserver", handler="/api/comments"}

# Return a whole range of time for the same vector
http_requests_total{job="apiserver", handler="/api/comments"}[5m]

# Use regular expression to select query selective data
http_requests_total{job=~".*server"}

#Return the 5-minute rate of the http_requests_total metric for the past 30 minutes, with a resolution of 1 minute.
rate(http_requests_total[5m])[30m:1m]
AlertManager
Alertmanager, a Prometheus plugin, routes alerts to various destinations like email, Slack, or PagerDuty. It excels at deduplicating, grouping, and routing alerts to the appropriate receivers. Additionally, it allows for silencing and inhibiting alerts based on specific criteria.
Key functionalities of Alertmanager include:
- Deduplication: Prevents alert spamming by sending only one notification for a recurring issue.
- Grouping: Groups related alerts together based on shared labels, providing a more concise view of potential problems.
- Routing: Directs alerts to the designated receiver integrations based on predefined configurations.
- Silencing: Allows you to temporarily suppress alerts that are not critical or that you are already aware of.
- Inhibition: Prevents alerts from being triggered if they are caused by other higher-priority alerts.
Prometheus utilizes a rule-based alerting system. You define rules that specify when an alert should be sent. To create an Alertmanager rule, you’ll need to configure the following:
Metric:The metric that you want to monitor.Operator:The comparison operator that you want to use.Threshold:The value that the metric must cross in order to trigger an alert.Duration:The amount of time that the metric must exceed the threshold in order to trigger an alert. Once a rule is defined, Prometheus continuously monitors the metric. If the metric breaches the threshold for the specified duration, an alert will be sent through Alertmanager to the designated notification channels. Example of a Prometheus alert rule:
alert: HighCPUUsage
expr: cpu_usage_percent{job="web"} > 90
for: 5m
labels
  severity: critical
annotations:
  summary: CPU usage for the web job is above 90%.
  description: CPU usage for the web job has been above 90% for the past 5 minutes.
This rule triggers a notification if CPU usage for the “web” job remains above 90% for 5 minutes. Additionally, the alert will be labeled with a “critical” severity to ensure it receives the necessary attention.
I have tried to explain the same using the following video. If you have any questions you can comment on the YouTube video.
Conclusion:
Prometheus offers a powerful and versatile monitoring solution, empowering you to gain deep insights into the health and performance of your microservices and containerized applications. By leveraging its functionalities like service discovery, time-series data storage with PromQL, and alert management with Alertmanager, you can proactively identify and address potential issues before they significantly impact your systems.
Important links